


WEBINAR TO BE HELD ON FRIDAY, MARCH 28 @ 10:00 AM EDT
Register here:
https://6ix.com/event/wallbridge-mining-corporate-update
TORONTO, March 27, 2025 (GLOBE NEWSWIRE) -- Wallbridge Mining Company Limited (TSX:WM, OTCQB:WLBMF) ("Wallbridge” or the "Company”) is pleased to report results from an updated positive Preliminary Economic Assessment ("PEA”) completed on its 100%-owned Fenelon gold project ("Fenelon” or the "Project”) located in the Abitibi Greenstone Belt, along the Detour-Fenelon Gold Trend, Quebec. A PEA prepared in accordance with National Instrument 43-101 - Standards of Disclosure for Mineral Projects ("NI 43-101”) has been filed on SEDAR+ and is available on the Company's website and can be accessed here.
All results herein are reported in Canadian dollars unless otherwise indicated.
PEA HIGHLIGHTS
- Average annual gold production of 107,000 oz per year over 16-year life of mine ("LOM”); 96% average gold recovery
- Average annual gold production of 127,000 oz during the first five years
- Average annual free cash flow of $120 million over LOM
- After-tax Internal Rate of Return ("IRR”) of 21%
- After-tax Net Present Value ("NPV”) of $706 million at base case gold price of US$2,200 and CAD$:US$ of 1.35:1.00 at a 5% discount rate
- Initial capital expenditures (1) of $579 million
- Sustaining capital expenditures (1) of $449 million
- Total cash costs (1) of US$851/oz
- All-in sustaining costs (1) ("AISC”) of US$1,046/oz
- 16.6 Mt of mineralized material mined at an average grade of 3.34 g/t
- Non-IFRS financial measures with no standardized definition under IFRS. Refer to Non-IFRS Measures at end of this news release.
Brian Penny, CEO of Wallbridge, commented:
"Fenelon is a gold project with tremendous potential. This updated Fenelon PEA generates strong project economics under a lower risk, higher grade, lower startup capital scenario. Fenelon has now reached another milestone with a robust PEA that demonstrates a viable path to development and attractive economic returns based on reasonable assumptions. The PEA was designed to be rigorous, using current cost data from contractors, suppliers and mining companies operating in the region to arrive at realistic projections. It represents a new starting point to build upon as we scope out the full opportunities at Fenelon and Martiniere, the two most advanced projects on our large, underexplored property.
In this historically high gold price environment, we need to rapidly advance the project. The current plan has a shorter payback than the previous plan and allows us to consider expansion options after payback has been achieved.
I would like to thank everyone who contributed to the completion of this study, as well as our employees, stakeholders, and shareholders for their continuous support. I believe Wallbridge has a bright future, and we look forward to taking the necessary steps to increase value for our shareholders.”
Table 1: PEA Summary of Key Metrics and Project Economics
| SUMMARY OF PROJECT ECONOMICS | Mar 21, 2025 | |
| Base case gold price | (US$) | 2,200 |
| Exchange rate | (CAD$:US$) | 1.35:1.00 |
| Discount rate | (%) | 5.0 |
| NSR Royalty on Fenelon Mine Property | (%) | 4.0 |
| Mining Parameters | ||
| Average grade mined | (g/t) | 3.34 |
| Cut-off grades | (g/t) | 2.25 (CTC)
2.51 (A51) |
| Mining rate | (tpd) | 3,000 |
| Total tonnage mined | (Mt) | 16.6 |
| Mine life | (years) | 16.0 |
| Processing Parameters | ||
| Processing recovery | (%) | 96.0 |
| Processing rate | (tpd) | 3,000 |
| Total tonnage milled | (Mt) | 16.6 |
| Average annual production | (oz/year) | 107,000 |
| Average annual production(first five years) | (oz/year) | 127,000 |
| Total production | (oz) | 1,711,000 |
| Capital Expenditures | ||
| Initial capital expenditure(3) | ($M) | 579 |
| Sustaining capital expenditure(3) | ($M) | 449 |
| Closure costs(3) | ($M) | 9 |
| Salvage value | ($M) | 26 |
| Operating Costs | ||
| Total operating costs | ($/t milled) | 106 |
| Cost Per Ounce | ||
| LOM total cash costs(1) (3) | (US$/oz) | 851 |
| LOM all-in sustaining costs(2) (3) | (US$/oz) | 1,046 |
| Financial Analysis | ||
| Pre-tax NPV5% | ($M) | 1,176 |
| Pre-tax IRR | (%) | 27 |
| Post-tax NPV5% | ($M) | 706 |
| Post-tax IRR | (%) | 21 |
| Post-tax payback period (from start of commercial production) | (years) | 4.0 |
| Profitability Index (post-tax NPV5%/initial capital) | - | 1.22 |
- Total cash costs per ounce are operating costs, composed of mining (UG and OP), processing, water treatment and tailings, minesite G&A and royalty costs, divided by payable gold ounces.
- AISC/oz includes operating costs, sustaining capital expenditures to support the on-going operations, and closure costs, divided by payable gold ounces.
- Non-IFRS financial measures with no standardized definition under IFRS. Refer to note at end of this news release.
The PEA assumes a base case gold price of US$2,200/oz. Using that base case assumption, the Project generates an after-tax NPV of $706 million using a 5% discount rate and an after-tax IRR of 21%.
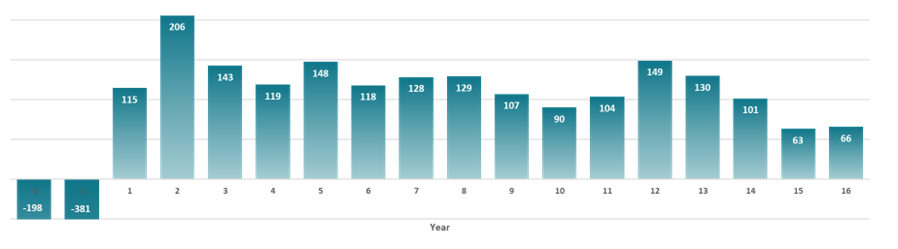
The Project generates cumulative free cash flow of $1,367 million and averages annual free cash flow of $120 million over a mine life of 16 years (Figure 1). Total taxes payable over LOM at the base case gold price is $776 million.
Figure 1. Annual After-Tax Free Cash Flow (millions)
Sensitivities
The PEA financial economic analysis is significantly influenced by gold prices. At a gold price of US$3,000/oz and FX of CAD$:US$ of 1.35:1.00, the Project generates an after-tax NPV of $1,381 million and an after-tax IRR of 34% with a payback period of 2.4 years from the start of commencement of production (Table 2).
Table 2: PEA Sensitivity Analysis Gold Price
| Gold Price (USD) | FX | NPV ($M) | IRR | Payback (Years) |
| 1800 (-18%) | 1.35 | 353 | 13% | 5.7 |
| 1900 (-14%) | 1.35 | 443 | 15% | 5.0 |
| 2000 (-9%) | 1.35 | 532 | 17% | 4.6 |
| 2100 (-5%) | 1.35 | 619 | 19% | 4.3 |
| 2200 | 1.35 | 706 | 21% | 4.0 |
| 2300 (+5%) | 1.35 | 792 | 22% | 3.7 |
| 2400 (+9%) | 1.35 | 878 | 24% | 3.4 |
| 2500 (+14%) | 1.35 | 963 | 26% | 3.1 |
| 2600 (+18%) | 1.35 | 1047 | 27% | 2.9 |
| 3000 (+36%) | 1.35 | 1381 | 34% | 2.4 |
| Operating Costs | NPV ($M) | IRR |
| Base Case -30% | 912 | 25% |
| Base Case -20% | 845 | 24% |
| Base Case -10% | 776 | 22% |
| Base Case 0% | 706 | 21% |
| Base Case +10% | 635 | 19% |
| Base Case +20% | 563 | 18% |
| Base Case +30% | 490 | 16% |
| Capital Expenditures | NPV ($M) | IRR |
| Base Case -30% | 855 | 30% |
| Base Case -20% | 806 | 26% |
| Base Case -10% | 756 | 23% |
| Base Case 0% | 706 | 21% |
| Base Case +10% | 655 | 19% |
| Base Case +20% | 604 | 17% |
| Base Case +30% | 552 | 15% |
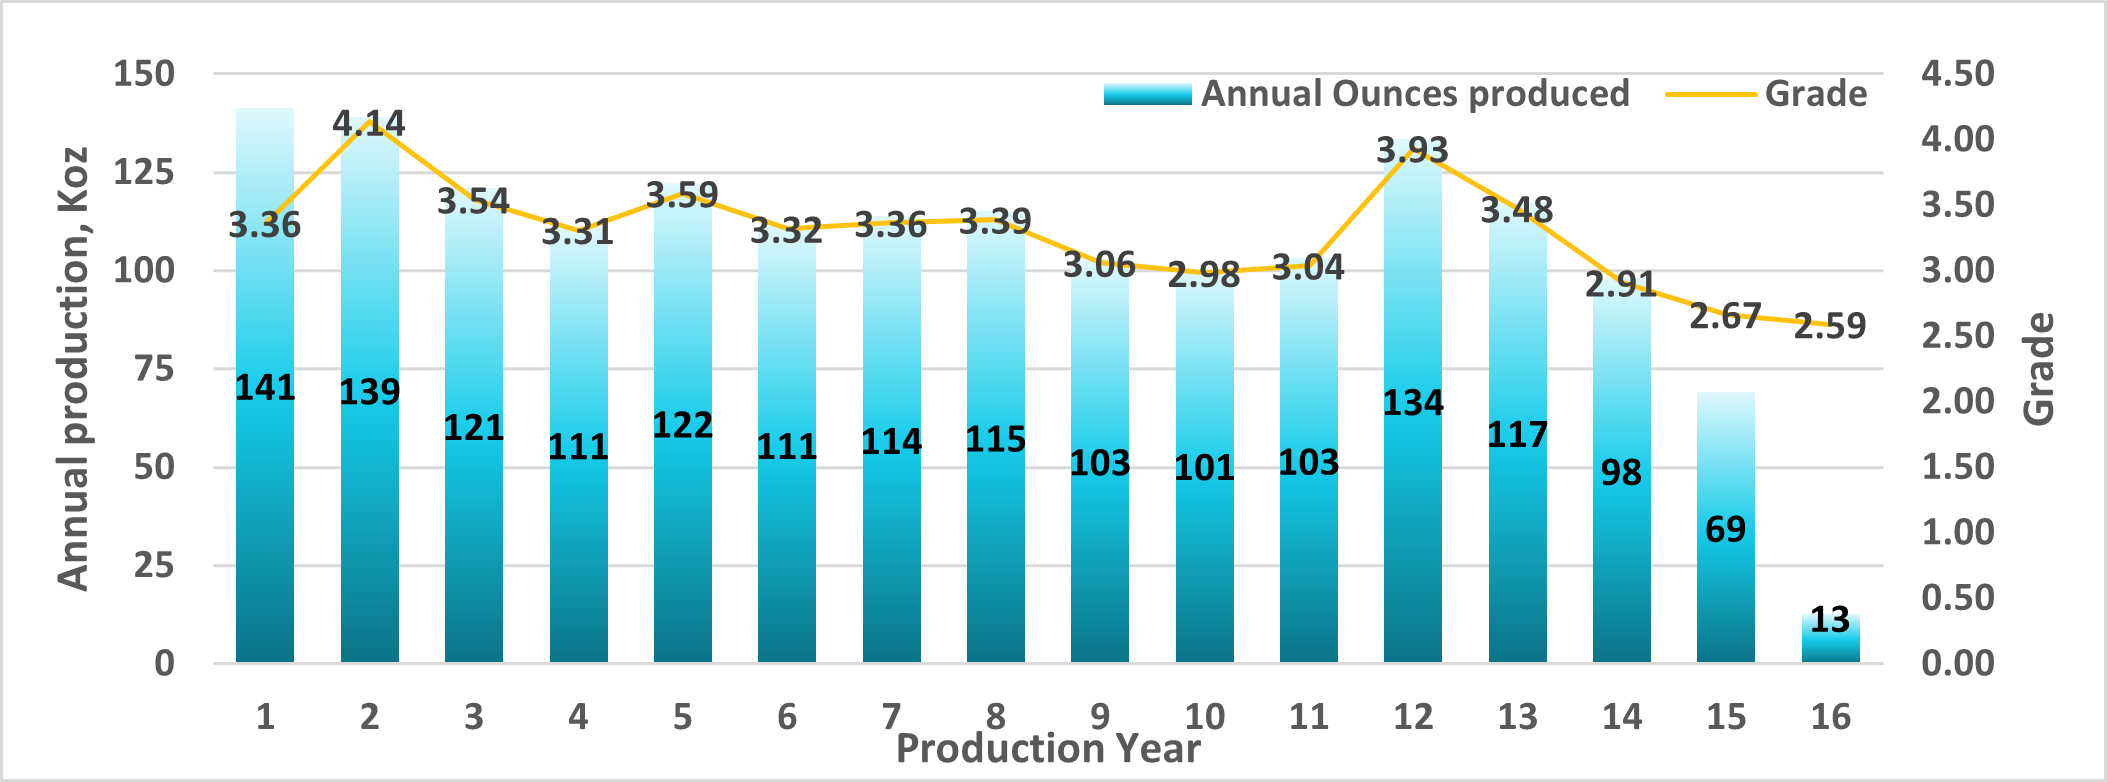
Production
Annual production over LOM is expected to average 107,000 ounces with peak production of 141,000 ounces in year 1 (Figure 2).
Figure 2. Production Profile
Capital Expenditures
The initial capital expenditures are estimated at $579 million, and the sustaining capital expenditures are estimated at $449 million (Tables 3 & 4). A contingency of $57 million and $20 million is included in initial and sustaining capital expenditures, respectively.
Initial and sustaining capital expenditures were estimated based on current costs received from vendors as well as developed from first principles, while some were estimated based on factored references and experience from similar operating projects.
Table 3: Initial Capital Expenditures
| Cost Element | Initial Capital ($M)1,2 |
| Mill | 217 |
| Paste Plant | 43 |
| Tailings and Water Treatment | 22 |
| Capitalized Operating (Pre-production) | 75 |
| Surface Civil & Infrastructure | 80 |
| Mining Equipment | 31 |
| Underground Development | 54 |
| Underground Infrastructure | 28 |
| Hydro Electric Line & Distribution | 29 |
| Total Initial Capital | $579 |
- All values stated are undiscounted. No depreciation of costs was applied.
- Non-IFRS financial measures with no standardized definition under IFRS. Refer to Non-IFRS Measures at end of this news release.
| Cost Element | Sustaining Capital ($M)1,2,3 |
| Mining Equipment | 145 |
| Development | 161 |
| Tailings & Water Treatment | 64 |
| Paste Distribution Network | 8 |
| Underground Infrastructure | 32 |
| Surface Infrastructure | 29 |
| Closure | 9 |
| Open pit (OB Excavation + Contractor) | 3 |
| Total Sustaining Capital | $449 |
- All values stated are undiscounted. No depreciation of costs was applied.
- Non-IFRS financial measures with no standardized definition under IFRS. Refer to Non-IFRS Measures at end of this news release.
- Due to rounding, columns may not add up.
The total unit cash costs are estimated at US$851/oz. The AISC is estimated at US$1,046/oz. Operating cost estimates were developed using first principles methodology, vendor quotes, and productivities being derived from benchmarking and industry practices.
Table 5: Total Cash Costs
| LOM Total $ million | Average LOM ($/tonne milled) | Average LOM (US$/oz) | |
| Mining (UG & OP) | 900 | 56 | 390 |
| Processing | 423 | 25 | 183 |
| Water Treatment & Tailings | 66 | 4 | 28 |
| General & Admin. | 374 | 22 | 162 |
| Royalty (4%) | 202 | 12 | 88 |
| Total Cash Costs 2,3 | 1,965 | 119 | 851 |
- All values stated are undiscounted. No depreciation of costs has been applied.
- Non-IFRS financial performance measures with no standardized definition under IFRS. Refer to Non-IFRS Measures at the end of this news release.
- Total cash costs include mining (UG and OP), processing, water treatment and tailings, minesite G&A and royalty costs.
The updated mineral resource estimates ("MRE”) for the Fenelon and Martiniere deposits presented in this news release were prepared by Mauro Bassotti, P.Geo., an independent mineral resource consultant using all available information. The effective date of the 2025 MRE is March 20, 2025. The databases supporting the 2025 MREs are complete, valid and up to date, with close-out dates of October 22, 2024 and January 8, 2025 for Fenelon and Martiniere respectively. The 2025 Mineral Resource Statement for the Detour-Fenelon Gold Trend Property is presented below in Table 6. The statement provides the consolidated estimates for the Fenelon and Martiniere deposits. Details are provided in Item 14 of the PEA technical report.
Table 6: Detour-Fenelon Gold Trend Property 2025 Mineral Resource Statement by Deposit
| DEPOSIT | INDICATED | INFERRED | |||||
| Tonnes (000's) | Gold Grade (Au g/t) | Gold Ounces (000's) | ()[\]\\.,;:\s@\"]+)*)|(\".+\"))@((\[[0-9]{1,3}\.[0-9]{1,3}\.[0-9]{1,3}\.[0-9]{1,3}\])|(([a-zA-Z\-0-9]+\.)+[a-zA-Z]{2,}))$/;return b.test(a)}$(document).ready(function(){if(performance.navigation.type==2){location.reload(true)}$("iframe[data-lazy-src]").each(function(b){$(this).attr("src",$(this).attr("data-lazy-src"))});if($(".owl-article-body-images").length){$(".owl-article-body-images").owlCarousel({items:1,loop:true,center:false,dots:false,autoPlay:true,mouseDrag:false,touchDrag:false,pullDrag:false,nav:true})}var a=$("#display_full_text").val();if(a==0){$.ajax({url:"/ajax/set-article-cookie",type:"POST",data:{cmsArticleId:$("#cms_article_id").val()},dataType:"json",success:function(b){},error:function(b,d,c){}})}$(".read-full-article").on("click",function(d){d.preventDefault();var b=$(this).attr("data-cmsArticleId");var c=$(this).attr("data-productId");var f=$(this).attr("data-href");dataLayer.push({event:"paywall_click",paywall_name:"the_manila_times_premium",paywall_id:"paywall_article_"+b});$.ajax({url:"/ajax/set-article-cookie",type:"POST",data:{cmsArticleId:b,productId:c},dataType:"json",success:function(e){window.location.href=$("#BASE_URL").val()+f},error:function(e,h,g){}})});$(".article-embedded-newsletter-form .close-btn").on("click",function(){$(".article-embedded-newsletter-form").fadeOut(1000)})});$(document).on("click",".article-embedded-newsletter-form .newsletter-button",function(){var b=$(".article-embedded-newsletter-form .newsletter_email").val();var d=$("#ga_user_id").val();var c=$("#ga_user_yob").val();var a=$("#ga_user_gender").val();var e=$("#ga_user_country").val();if(validateEmail(b)){$.ajax({url:"/ajax/sendynewsletter",type:"POST",data:{email:b},success:function(f){$(".article-embedded-newsletter-form .nf-message").html(f);$(".article-embedded-newsletter-form .nf-message").addClass("show");setTimeout(function(){$(".article-embedded-newsletter-form .nf-message").removeClass("show");$(".article-embedded-newsletter-form .nf-message").html("")},6000);dataLayer.push({event:"newsletter_sub",user_id:d,product_name:"newsletter",gender:a,yob:c,country:e})},error:function(f,h,g){}})}else{$(".article-embedded-newsletter-form .nf-message").html("Please enter a valid email address.");$(".article-embedded-newsletter-form .nf-message").addClass("show");setTimeout(function(){$(".article-embedded-newsletter-form .nf-message").removeClass("show");$(".article-embedded-newsletter-form .nf-message").html("")},6000)}});$(document).on("click",".article-embedded-newsletter-form .nf-message",function(){$(this).removeClass("show");$(this).html("")});
| ||||