


MONTREAL, Feb. 24, 2025 (GLOBE NEWSWIRE) -- Aya Gold & Silver Inc. (TSX: AYA; OTCQX: AYASF) ("Aya” or the "Corporation”) is pleased to announce an updated Mineral Resource Estimate ("MRE”) prepared in accordance with National Instrument 43-101 - Standards of Disclosure for Mineral Projects ("NI 43-101”) at its Boumadine Project in the Kingdom of Morocco. The updated MRE contains an Inferred Mineral Resource of 29.2 million tonnes ("Mt”) at 82 grams per tonne ("g/t”) silver ("Ag”), 2.63 g/t gold ("Au”), 2.11% zinc ("Zn”) and 0.82% lead ("Pb”) containing an estimated 76.8 million ounces ("Moz”) of Ag, 2.4Moz of Au, 615 thousand tonnes ("kt”) of Zn and 237 kt of Pb and an Indicated Mineral Resource of 5.2Mt at 91 g/t Ag, 2.78 g/t Au, 2.8% Zn and 0.85% Pb containing an estimated 15.1 Moz of Ag, 449 kilo ounces ("koz”) of Au, 145 kt of Zn and 44 kt of Pb.
Highlights
- Indicated Mineral Resources of 5.2Mt at 91 g/t Ag, 2.78 g/t Au, 2.8% Zn and 0.85% Pb containing an estimated 15.1 Moz of Ag, 449 koz of Au, 145 kt of Zn and 44 kt of Pb. Representing 74.4 Moz Silver equivalent ("AgEq”), an increase of 120%.
- Inferred Mineral Resources of 29.2 Mt at 82g/t Ag, 2.63 g/t Au, 2.11% Zn and 0.82% Pb containing an estimated 76.8 Moz of Ag, 2.4 Moz of Au, 615 kt of Zn and 237 kt of Pb. Representing 378Moz AgEq, an increase of 19%.
- 49% of the Inferred Mineral Resource is pit-constrained and reported above a cut-off net smelter royalty ("NSR”) value of $95/t, and 51% deemed for underground development NSR cut-off value of US$125/t.
- Additional mineral resource potential to expand the deposit in all directions for future mineral resource estimation. With a land package of 271.5 square kilometers ("km2”) in addition to a 600 km2 exploration authorization, new targets are being tested.
"Drilling has primarily focused on the mining permit, which represents only a small portion of the broader mineralized footprint. Over the past two years, we have expanded our footprint by nearly 850% and continue to consolidate the area while aggressively testing extensions of known mineralized trends. Additionally, ongoing metallurgical studies are yielding promising results as we advance the project toward large-scale development.”
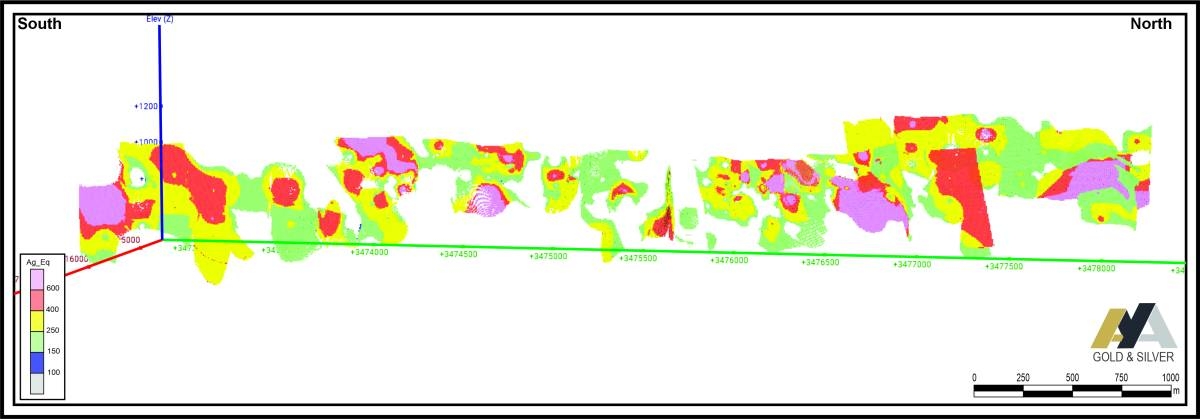
Boumadine Mineral Resource
The MRE is effective as of February 24, 2025, and includes drilling conducted from 2018 through December 1, 2024. The database comprises 428 surface diamond drill holes ("DDH”), totaling 142,268 meters ("m”). For this updated MRE, 93 new DDH, totaling 44,514m, were incorporated.
Historical mining was not depleted from the MRE as the exact position and physical extent could not be accurately measured. From the historical production reports, approximately 261kt of mineralized material were extracted and processed (less than 1% of the current MRE), therefore it is considered not material. Historical tailings were excluded from the MRE since the bulk density, volumes and grades were not properly evaluated. Molybdenum was excluded from both the cut-off and AgEq/AuEq calculations since the process recoveries were not evaluated.
Table 1 -Boumadine MRE, as of February 24, 2025 (1-12)
| Cutoff | Tonnes | Average Grade | Contained Metal | |||||||||||||
| Ag | Au | Cu | Pb | Zn | AgEq | AuEq | Ag | Au | Cu | Pb | Zn | AgEq | AuEq | |||
| NSR US$/t | (kt) | (g/t) | (g/t) | (%) | (%) | (%) | (g/t) | (g/t) | (koz) | (koz) | (kt) | (kt) | (kt) | (koz) | (koz) | |
| Pit-constrained Indicated | 95 | 3,920 | 94 | 2.99 | 0.13 | 0.84 | 2.95 | 476 | 5.30 | 11,881 | 343 | 5 | 33 | 116 | 60,051 | 667 |
| Pit-constrained
Inferred | 95 | 14,258 | 90 | 2.89 | 0.10 | 0.81 | 2.38 | 450 | 5.00 | 41,135 | 1,102 | 14 | 115 | 339 | 206,293 | 2,293 |
| Out-of-pit Indicated | 125 | 1,249 | 80 | 2.11 | 0.08 | 0.87 | 2.32 | 358 | 3.98 | 3,216 | 106 | 1 | 11 | 29 | 14,382 | 160 |
| Out-of-pit
Inferred | 125 | 14,938 | 74 | 2.39 | 0.07 | 0.82 | 1.85 | 357 | 3.97 | 35,669 | 1,294 | 10 | 122 | 276 | 171,393 | 1,905 |
| Total
Indicated | 95/ 125 | 5,169 | 91 | 2.78 | 0.12 | 0.85 | 2.80 | 448 | 4.98 | 15,097 | 449 | 6 | 44 | 145 | 74,433 | 827 |
| Total Inferred | 95/
125 | 29,196 | 82 | 2.63 | 0.08 | 0.82 | 2.11 | 402 | 4.47 | 76,804 | 2,396 | 25 | 237 | 615 | 377,686 | 4,198 |
- Mineral Resources are not Mineral Reserves and do not have demonstrated economic viability. The estimate of Mineral Resources may be materially affected by environmental, permitting, legal, title, taxation, socio-political, marketing, or other relevant issues. There is no certainty that Mineral Resources will be converted to Mineral Reserves.
- The Inferred Mineral Resource in this estimate has a lower level of confidence than that applied to an Indicated Mineral Resource and must not be converted to a Mineral Reserve. It is reasonably expected that the majority of the Inferred Mineral Resource could be upgraded to an Indicated Mineral Resource with continued exploration.
- The Mineral Resources in this news release were estimated in accordance with the Canadian Institute of Mining, Metallurgy and Petroleum (the "CIM”) Standards on Mineral Resources and Mineral Reserves Definitions (2014) and Best Practices Guidelines (2019) prepared by the CIM Standing Committee on Reserve Definitions and adopted by the CIM Council, as may be amended from time to time.
- A silver price of US$24/oz with a process recovery of 89%, a gold price of US$2,200/oz with a process recovery of 85%, a zinc price of US$1.20/lb with a process recovery of 72%, a lead price of US$1.00/lb with a process recovery of 85%, and a copper price of US$4.00/lb with a process recovery of 75% were used in establishing the MRE.
- AgEq = Ag(g/t) + (Au(g/t) *Au price/oz*Au recovery)/(Ag price/oz*Ag recovery) + Zn(%)*Zn price/lb* Zn recovery/(Ag price/oz*Ag recovery)*685.7147973 + Pb(%)*Pb price/lb* Pb recovery/(Ag price/oz*Ag recovery)*685.7147973 + Cu(%)*Cu price/lb* Cu recovery/(Ag price/oz*Ag recovery)*685.7147973
- AuEq = Au(g/t) + (Ag(g/t) *Ag price/oz*Ag recovery)/(Au price/oz*Au recovery) + Zn(%)*Zn price/lb* Zn recovery/(Au price/oz*Au recovery)*685.7147973 + Pb(%)*Pb price/lb* Pb recovery/(Au price/oz*Au recovery)*685.7147973 + Cu(%)*Cu price/lb* Cu recovery/(Au price/oz*Au recovery)*685.7147973.
- The constraining pit optimization parameters were US$3.5/t for mineralized material mining. US$2/t for waste mining US$89/t for processing and US$6/t for G&A totalling US$95/t for a cut-off and 50-degree pit slopes.
- The out-of-pit parameters used a US$30/t mining cost, US$89/t processing cost and US$6/t G&A totalling US$125/t for a cut-off The out-of-pit Mineral Resource grade blocks were quantified above the US$125 NSR cut-off, below the constraining pit shell and within the constraining mineralized wireframes. Out-of-pit Mineral Resources exhibit continuity and reasonable potential for extraction by the long hole underground mining method.
- Individual calculations in tables and totals may not sum due to rounding of original numbers.
- Grade capping of 800 g/t Ag, 30 g/t Au, 28% Zn, 10% Pb and 1.4% Cu was applied to composites before grade estimation.
- Bulk density was evaluated separately for each individual vein with values ranging from 3.20 to 4.00 t/m3 determined from drill core samples and used for the MRE. For oxidized and transitional material, a bulk density of 2.65 t/m3 was used.
- 1.0 m composites were used during grade estimation.
| Indicated InPit and Underground Resources | ||||||||||||
| UG-OP | Tonnes | Ag | Ag | Au | Au | Cu | Pb | Zn | AgEq | AgEq | AuEq | AuEq |
| NSR US$/t | (kt) | (g/t) | (koz) | (g/t) | (koz) | (%) | (%) | (%) | (g/t) | (koz) | (g/t) | (koz) |
| 145-120 | 4,472 | 97 | 13,923 | 3.05 | 439 | 0.12 | 0.86 | 2.75 | 484 | 69,632 | 5.40 | 777 |
| 140-115 | 4,625 | 95 | 14,110 | 2.99 | 444 | 0.12 | 0.86 | 2.72 | 476 | 70,751 | 5.30 | 788 |
| 135-110 | 4,791 | 93 | 14,359 | 2.92 | 450 | 0.12 | 0.86 | 2.69 | 467 | 71,933 | 5.20 | 801 |
| 130-105 | 4,932 | 92 | 14,547 | 2.86 | 453 | 0.12 | 0.85 | 2.66 | 460 | 72,898 | 5.11 | 810 |
| 125-95 | 5,169 | 89 | 14,863 | 2.77 | 460 | 0.11 | 0.84 | 2.63 | 448 | 74,433 | 4.98 | 827 |
| 120-90 | 5,298 | 88 | 15,008 | 2.72 | 463 | 0.11 | 0.83 | 2.60 | 442 | 75,250 | 4.90 | 834 |
| 115-85 | 5,481 | 87 | 15,265 | 2.66 | 469 | 0.11 | 0.82 | 2.57 | 433 | 76,364 | 4.81 | 848 |
| 110-80 | 5,648 | 85 | 15,477 | 2.60 | 473 | 0.11 | 0.81 | 2.55 | 426 | 77,320 | 4.73 | 858 |
| 105-75 | 5,820 | 84 | 15,683 | 2.54 | 476 | 0.10 | 0.80 | 2.53 | 418 | 78,268 | 4.64 | 868 |
| 90-60 | 6,284 | 79 | 16,061 | 2.39 | 483 | 0.10 | 0.78 | 2.46 | 399 | 80,571 | 4.40 | 890 |
| Inferred InPit and Underground Resources | ||||||||||||
| UG-OP | Tonnes | Ag | Ag | Au | Au | Cu | Pb | Zn | AgEq | AgEq | AuEq | AuEq |
| NSR US$/t | (kt) | (g/t) | (koz) | (g/t) | (koz) | (%) | (%) | (%) | (g/t) | (koz) | (g/t) | (koz) |
| 145-120 | 24,023 | 90 | 69,342 | 2.86 | 2,211 | 0.09 | 0.87 | 2.14 | 441 | 340,641 | 4.90 | 3,786 |
| 140-115 | 25,128 | 88 | 70,937 | 2.80 | 2,261 | 0.09 | 0.86 | 2.12 | 432 | 349,042 | 4.80 | 3,880 |
| 135-110 | 26,218 | 86 | 72,627 | 2.73 | 2,304 | 0.08 | 0.85 | 2.10 | 424 | 357,154 | 4.71 | 3,970 |
| 130-105 | 27,538 | 84 | 74,537 | 2.66 | 2,355 | 0.08 | 0.83 | 2.08 | 414 | 366,533 | 4.60 | 4,074 |
| 125-95 | 29,196 | 82 | 76,803 | 2.57 | 2,413 | 0.08 | 0.82 | 2.06 | 402 | 377,685 | 4.47 | 4,198 |
| 120-90 | 30,517 | 80 | 78,494 | 2.51 | 2,463 | 0.08 | 0.80 | 2.03 | 394 | 386,356 | 4.38 |
|