

EVERETT, Wash., Oct. 28, 2024 (GLOBE NEWSWIRE) -- Coastal Financial Corporation (Nasdaq: CCB) (the "Company”, "Coastal", "we", "our", or "us"), the holding company for Coastal Community Bank (the "Bank”), through which it operates a community-focused bank with an industry leading banking as a service ("BaaS") segment, today reported unaudited financial results for the quarter ended September 30, 2024, including net income of $13.5 million, or $0.97 per diluted common share, compared to $11.6 million, or $0.84 per diluted common share, for the three months ended June 30, 2024.
Management Discussion of the Quarter
"The third quarter demonstrated strong momentum across both our community bank and CCBX operating segments, despite a still challenging operating environment,” said CEO Eric Sprink. "We saw high quality net loan growth of $92.4 million despite selling $423.7 million in loans. We are implementing strategies to increase fee income and we continue to build out and invest in an infrastructure that is scalable, and that we believe will enable us to be innovative leaders in financial services.”
Key Points for Third Quarter and Our Go-Forward Strategy
- Balance Sheet Well Positioned for Lower Rates. Our balance sheet stands in a modestly liability sensitive position as of September 30, 2024, with $1.95 billion of CCBX deposits that contractually reprice lower immediately upon any reduction in the Federal Funds Rate, with $1.09 billion of CCBX loans repricing in 90 days or less following such reduction. The Federal Open Market Committee recently lowered the targeted Federal Funds rate 0.50% on September 19, 2024; a reduction of 0.50% compared to June 30, 2024 and September 30, 2023. The rate decrease came late in the quarter, so the full impact of this and any subsequent rate changes will be reflected in future periods.
- Expanding Relationships with CCBX Partners. We continue to focus on expanding product offerings with existing CCBX partners. We believe that launching new products with existing partners positions us to reach a wide and established customer base with modest increase in enterprise risk. Products launched in 2024 with existing partners have gained traction and are growing the balance sheet and increasing income. The pipeline for CCBX is active, although we expect to remain selective in adding new partners to manage risk and capital.
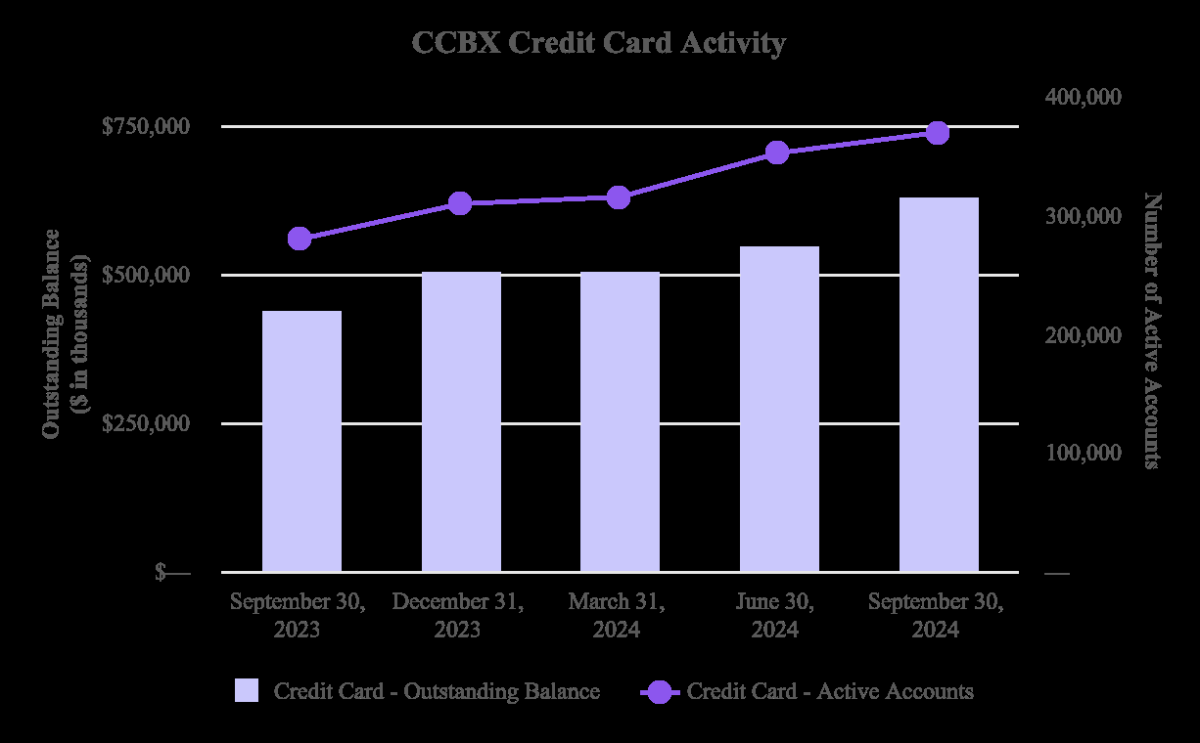
- On-going Loan Sales. We sold $423.7 million loans in the quarter ended September 30, 2024 as part of our strategy to balance credit risk, manage partner and lending limits, protect capital levels and move credit card balances to an off balance sheet fee generating model. We are retaining a portion of the fee income for our role in processing transactions on sold credit card balances. This provides an on-going and passive revenue stream with no on balance sheet risk.
- Continued Regulatory and Compliance Infrastructure Investments Position Us Well for Next Phase of Growth. We continue to utilize co-sourced personnel as a component of our risk and compliance efforts. This flexible co-sourcing approach allows us to manage the growth of our internal team while also ensuring CCBX has the resources it needs. While we remain 100% indemnified against partner fraud losses, we were encouraged to see fraudulent activity amongst our partners remains low during the current quarter, compared to the same period last year, a positive indicator of our continued investments in our risk infrastructure.
- Reorganization and Strengthening of Talent to Accommodate Growth and Plans for the Future. We recently announced the bifurcation of the President of the Bank into two roles, appointing Brian Hamilton as President of CCBX, the Fintech and BaaS segment of the Bank, with Curt Queyrouze serving as President of the community bank and corporate credit.
The tables below outline some of our key operating metrics.
| Three Months Ended | ||||||||||||||||||||
| (Dollars in thousands, except share and per share data; unaudited) | September 30,
2024 | June 30, 2024 | March 31, 2024 | December 31,
2023 | September 30, 2023 | |||||||||||||||
| Income Statement Data: | ||||||||||||||||||||
| Interest and dividend income | $ | 105,079 | $ | 97,487 | $ | 90,472 | $ | 88,243 | $ | 88,331 | ||||||||||
| Interest expense | 32,892 | 31,250 | 29,536 | 28,586 | 26,102 | |||||||||||||||
| Net interest income | 72,187 | 66,237 | 60,936 | 59,657 | 62,229 | |||||||||||||||
| Provision for credit losses | 70,257 | 62,325 | 83,158 | 60,789 | 27,253 | |||||||||||||||
| Net interest (expense)/ income after provision for credit losses | 1,930 | 3,912 | (22,222 | ) | (1,132 | ) | 34,976 | |||||||||||||
| Noninterest income | 80,068 | 69,918 | 86,955 | 64,694 | 34,579 | |||||||||||||||
| Noninterest expense | 65,616 | 58,809 | 56,018 | 51,703 | 56,501 | |||||||||||||||
| Provision for income tax | 2,926 | 3,425 | 1,915 | 2,847 | 2,784 | |||||||||||||||
| Net income | 13,456 | 11,596 | 6,800 | 9,012 | 10,270 | |||||||||||||||
| As of and for the Three Month Period | ||||||||||||||||||||
| September 30, 2024 | June 30, 2024 | March 31,
2024 | December 31, 2023 | September 30, 2023 | ||||||||||||||||
| Balance Sheet Data: | ||||||||||||||||||||
| Cash and cash equivalents | $ | 484,026 | $ | 487,245 | $ | 515,128 | $ | 483,128 | $ | 474,946 | ||||||||||
| Investment securities | 48,620 | 49,213 | 50,090 | 150,364 | 141,489 | |||||||||||||||
| Loans held for sale | 7,565 | - | 797 | - | - | |||||||||||||||
| Loans receivable | 3,418,832 | 3,326,460 | 3,199,554 | 3,026,092 | 2,967,035 | |||||||||||||||
| Allowance for credit losses | (170,263 | ) | (147,914 | ) | (139,258 | ) | (116,958 | ) | (101,085 | ) | ||||||||||
| Total assets | 4,065,821 | 3,961,546 | 3,865,258 | 3,753,366 | 3,678,265 | |||||||||||||||
| Interest bearing deposits | 3,047,861 | 2,949,643 | 2,888,867 | 2,735,161 | 2,637,914 | |||||||||||||||
| Noninterest bearing deposits | 579,427 | 593,789 | 574,112 | 625,202 | 651,786 | |||||||||||||||
| Core deposits (1) | 3,190,869 | 3,528,339 | 3,447,864 | 3,342,004 | 3,269,082 | |||||||||||||||
| Total deposits | 3,627,288 | 3,543,432 | 3,462,979 | 3,360,363 | 3,289,700 | |||||||||||||||
| Total borrowings | 47,847 | 47,810 | 47,771 | 47,734 | 47,695 | |||||||||||||||
| Total shareholders' equity | 331,930 | 316,693 | 303,709 | 294,978 | 284,450 | |||||||||||||||
| Share and Per Share Data (2): | ||||||||||||||||||||
| Earnings per share - basic | $ | 1.00 | $ | 0.86 | $ | 0.51 | $ | 0.68 | $ | 0.77 | ||||||||||
| Earnings per share - diluted | $ | 0.97 | $ | 0.84 | $ | 0.50 | $ | 0.66 | $ | 0.75 | ||||||||||
| Dividends per share | - | - | - | - | - | |||||||||||||||
| Book value per share (3) | $ | 24.51 | $ | 23.54 | $ | 22.65 | $ | 22.17 | $ | 21.38 | ||||||||||
| Tangible book value per share (4) | $ | 24.51 | $ | 23.54 | $ | 22.65 | $ | 22.17 |
| |||||||||||